
Voice assistants are a hot technology. Alexa and Google Assistant continue to expand reach through integrations into appliances, cars, and more. Enterprises, brands, and startups continue to launch voice assistant experiences for a variety of industries including media, retail, banking, food delivery, CPG, and more.
For the past three years, at Dashbot, we surveyed owners of Alexa and Google Home devices to better understand how they use their devices and what they think of them.
Key insights
- The devices continue to be behavior changing to a degree
- The core native functionality is still the most commonly used
- Purchasing within the devices has waned
- Third party app discovery is still an issue
- Privacy is a concern
- Users are happily satisfied with the devices and highly recommend them
Device usage continues to rise
As we saw in the previous two years, owners tend to use their devices quite frequently. The percentage of respondents who use their devices multiple times a day increased to 65% compared to 57% last year. Overall 77% of respondents use their devices at least once a day, up slightly from 75% last year.
 There are slight differences in the frequency of use by men and women. Men tend to be more likely to use the device multiple times a day compared to women – with 68.5% of men vs 61% of women using their device multiple times a day. Women skew slightly more likely to use the device less frequently – 27% of women use the device less than once a day compared to 20.6% of men.
Respondents with multiple devices tend to use their devices more frequently. While 51% of respondents who have only one device use the device multiple times a day, nearly 81% of respondents who have three or more devices, use their devices multiple times a day.
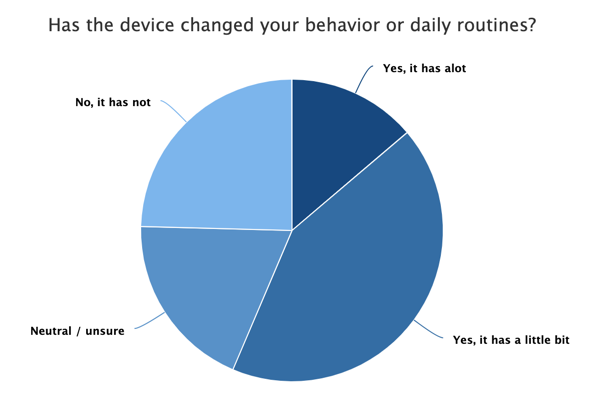
While frequency of use continues to rise, the percentage of respondents indicating the device has been behavior changed has dropped. Approximately 56% of respondents feel the device has been behavior changing this year compared to 65% last year. The biggest difference was with those who felt the device changed their behavior “a lot” – this year only about 14% agreed versus 25% last year.
 The interesting insight is that even those who felt the device has not been behavior changing, or are unsure, still use the device a lot. In fact, of those who felt the device was not behavior changing, 39.1% use the device multiple times a day, and another 12.9% use the device at least once a day. While they may not feel it is behavior changing, 52% are using the device every day. Similarly, of those who were unsure, 53.1% use the device multiple times a day, and another 14% use it at least once a day. They may be unsure, but 67% are using the device every day.
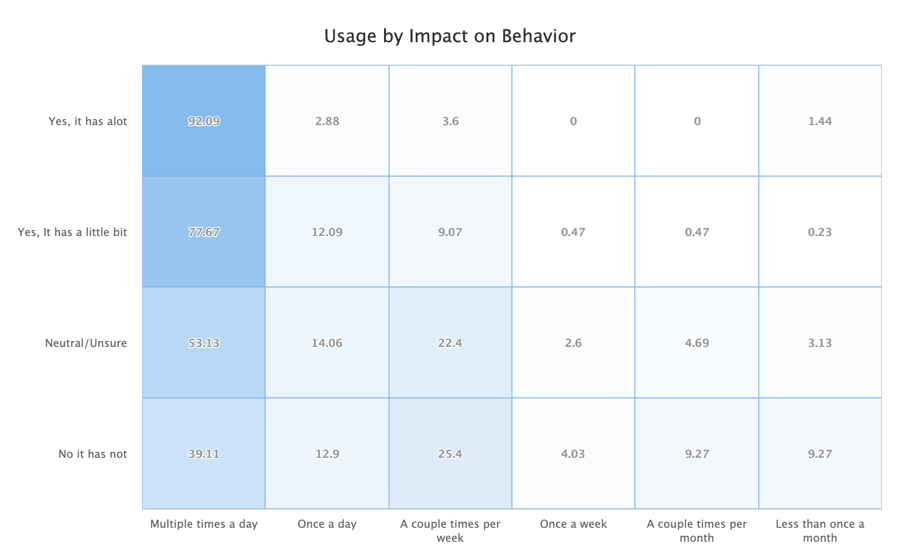 Of those who found the device to be “a lot” behavior changing, 92% use the device multiple times a day. Even among those who found the device “a little bit” behavior changing, over 77% are using the device multiple times a day.
Alexa, where are you?
As usage continues to rise, where are users interacting with these devices?
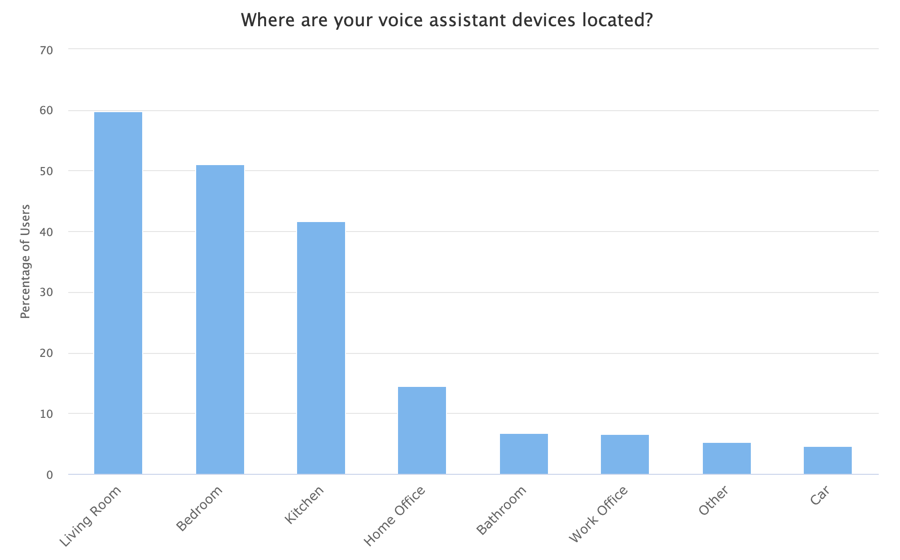 The most popular location for a voice assistant is in the living room. Nearly 60% of respondents have a device in their living room, followed by 51% who have one in the bedroom, and 42% who have one in the kitchen. After that, the locations drop off significantly with 14.5% having a device in a home office and 6.7% having one in the bathroom, amongst others.
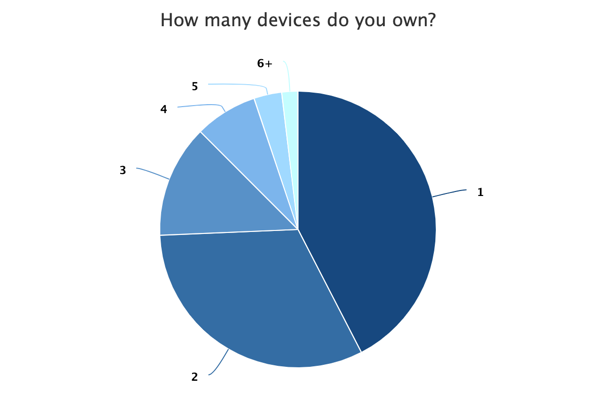
Users tend to have more than one device as well. Approximately 58% of respondents have two or more devices, with 26% having three or more devices.
 Comparing users who only have one device versus multiple, some interesting insights appear. For users who only have one device, the living room is still the most popular at 44.4%, followed by the kitchen at 29.7%, and the bedroom third at only 21.7%. For users who have multiple devices however, having one in the bedroom becomes very popular – in fact 86% of users who have three or more devices, have one in the bedroom, and it is also the second most popular location for those having two devices at 62%.
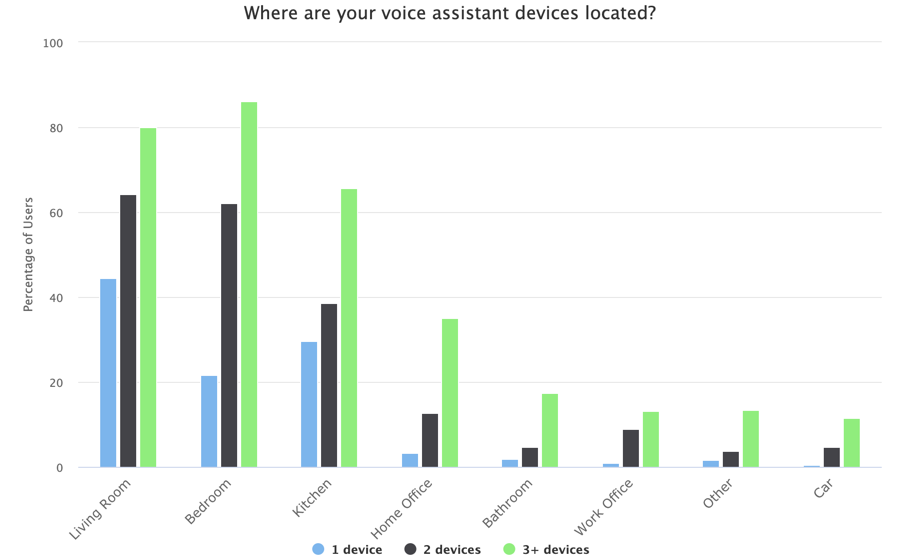 Of those respondents who indicated they have a device in an “other” room not mentioned, the most common rooms were the basement or garage. Funny enough, one person listed the device as still in the box!
Core features are the most commonly used
The core functionality of the device still tend to be the most common features used. Respondents use the devices for music, weather, and general information the most, whereas shopping, playing games, or using a specific skill tend to be less common.
 More than 85% of respondents use their devices to listen to music, 74% to check the weather, and nearly 70% to get information.
Listening to music is not only the most popular feature, but also one of the more frequently used. Nearly 43% listen to music multiple times a day and another 20% do so at least once a day. Checking the weather on the other hand is more of a once-a-day activity at 46% versus 24% who do so multiple times a day.
A less common, but frequently used feature is home automation. While only a third use this feature, of those who do, over 73% do so multiple times a day. It makes sense if people are using the device to control lights and other areas of the house.
Compared to last year, using the device for home automation increased quite a bit. Last year, home automation was the least common feature listed with only 23% of respondents indicating they use their devices for it. This year, more than 33% use their devices for it, moving the feature into the middle of the list.
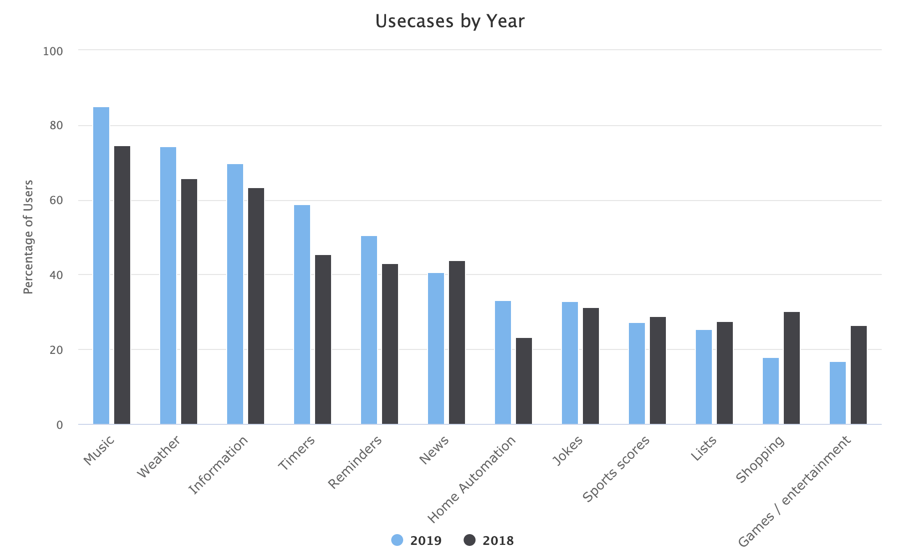 Use cases that had significant drop off in usage are Shopping and Games and Entertainment. Shopping dropped from 30% to 18% and Games and Entertainment dropped from 26% to less than 17%.
If we look at usage based on gender, the top features are fairly similar. The most common use cases for both men and women are music, weather, general information, timers, and reminders.
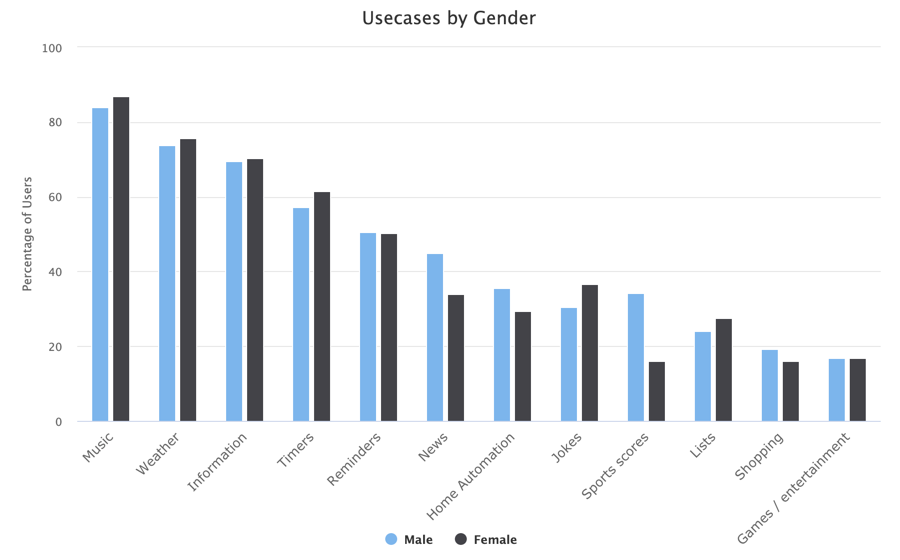 Where usage differs the most by gender is with news and sports scores, and to a lesser extent home automation and jokes. Nearly 45% of men use the device to get news information compared to 34% of women. Approximately 36% of men use the device for sport scores compared to 16% of women. The difference between men and women’s usage for home automation or jokes is closer at about 6% difference – with men more likely to use home automation and women more likely to ask for jokes.
Making purchases has dropped off
One area we dived deeper into last year was making purchases through the device. While we were excited by the positive signals, it appears the behavior has dropped off.
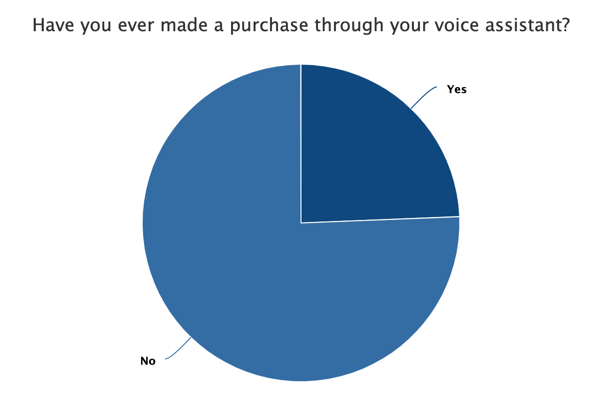 This year only 24% of respondents have made a purchase through their device compared to 43% last year. There could be a variety of reasons why – whether it is the user experience, the number of commerce options, a different audience segment, or perhaps something else.
Previously, respondents owning both an Alexa and a Google Home were much more likely to have made a purchase at 56% compared to 43% who only had an Alexa or 40% who only had a Google Home. This year however, that percentage dropped significantly – only 29% of respondents who have both devices made a purchase.
In regards to gender, men are more likely to have made a purchase than women. Over 28% of men versus 18% of women have made a purchase in the past. This is quite a bit off from last year as well where in 58% of men and 32% of women had made a purchase.
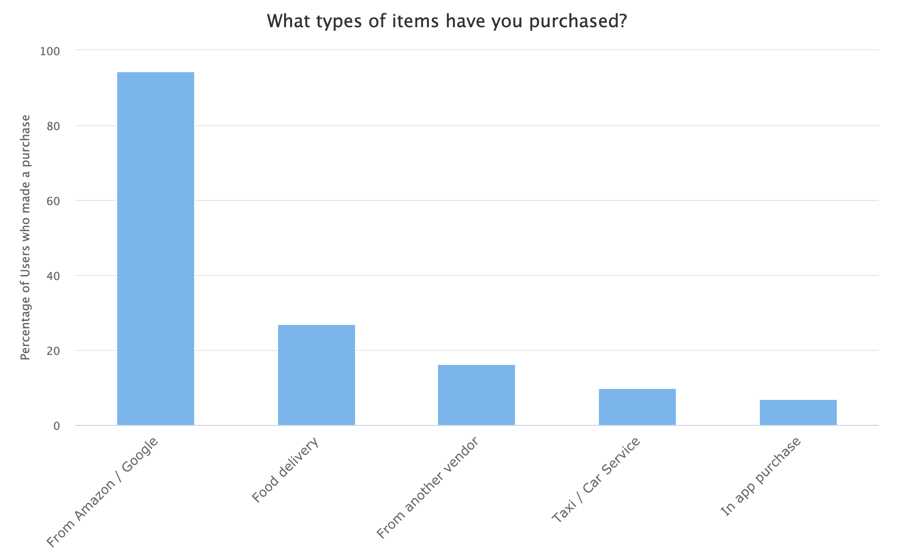
In terms of what respondents are purchasing, items from the underly Amazon or Google stores top the list by far at over 94%. Food ordering is a distance second at approximately 27%. This is significantly different from last year when nearly 53% of respondents who made a purchase did so for food delivery. Even in-app purchases has dropped off with less than 7% of respondents who made a purchase doing so, versus 15% last year.
 We also explored how likely users are willing to make a purchase in the future. While respondents likelihood to make future purchases skews positive, the responses are significantly lower than last year. Overall, over 43% of respondents are likely to make a purchase in the future, with 24% very likely, compared to only 18% who are not likely to make a purchase in the future.
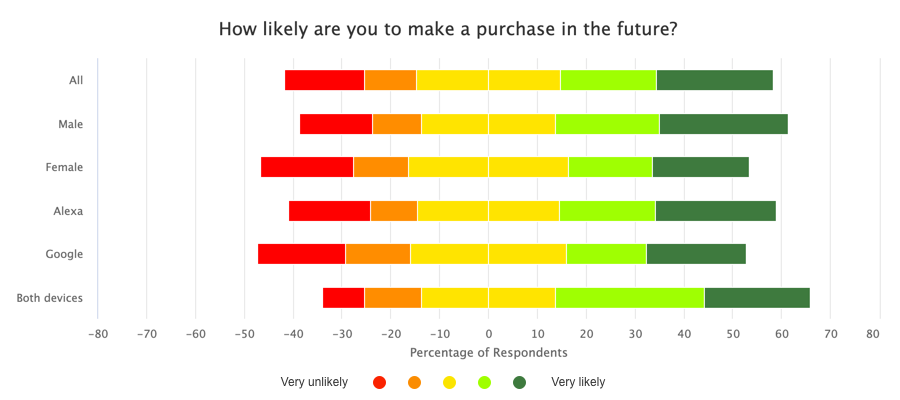 Men and respondents with both Alexa and Google Home devices continue to be more likely to make a purchase in the future. Approximately 48% of men compared to 37% of women are likely to make a future purchase. Similarly, 52% of respondents who have both devices are more likely to make a future purchase compared to 37% who only have a Google Home or 44% who have only have an Alexa.
Discovery of third party voice apps is still a challenge
As mentioned earlier, respondents primarily use their devices for the core native functionality. Only 13.5% of respondents use the device for third party skills. However, those who do, tend to use them frequently with 40% doing so multiple times a day and 22% once a day.
While respondents do use third party skills, they tend to only use a few. More than 54% of respondents only use one to three third party skills. Only 21% do not use any at all.
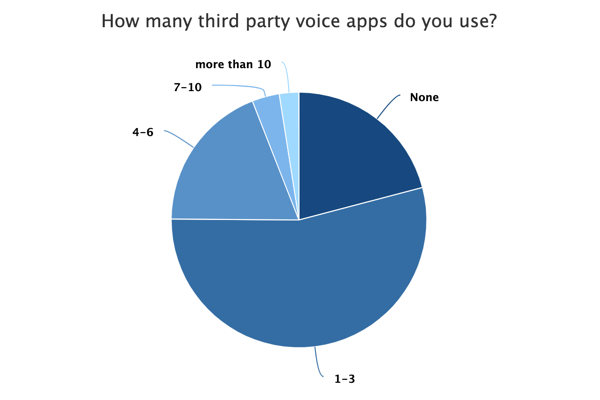 The issue appears to be discovery and user acquisition. As we mentioned in previous reports, some users do not even know what the third party voice apps are called.
Both Alexa and Google have taken steps to increase discovery, including by enabling developers to specify additional Intents their voice apps can handle. Alexa does this with their CanFulfillIntentRequest and Google does it with their Implicit Invocations. If a user asks the device for something without a specific voice app referenced, the platform can use this information to see if an existing voice app can handle the Intent and direct the user to the appropriate app.
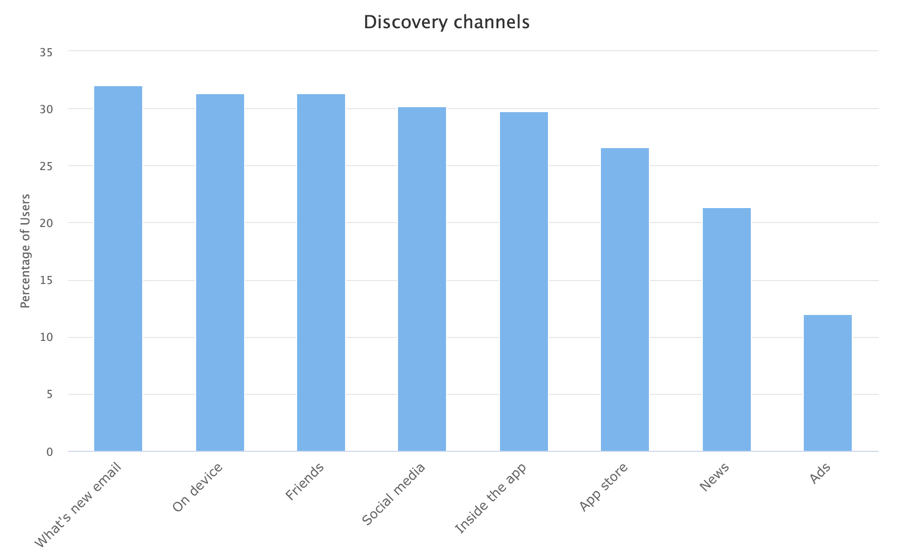 Three of the most common channels respondents are finding voice apps through are efforts of the underlying platforms. The most common is the “what’s new” email both Alexa and Google send, at 32%. Respondents are also discovery new voice apps on the device itself and inside the device’s companion app, at 31% and 30% respectively.
Respondents continue to discover new voice apps through their friends and social media as well.
Ads currently do not appear to be as effective as only 12% of respondents discover new voice apps through this channel.
Hello, is anyone else listening?
Privacy and security are key concerns of owners.
We asked respondents how concerned they are with security and privacy. More than 67% of respondents were at least a little concerned, with 19% of those very concerned. Only 27% of respondents were not concerned at all.
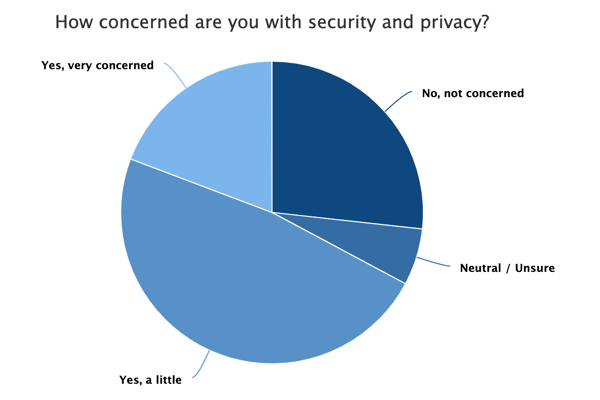 Respondents who use their devices multiple times a day tend to be slightly less concerned with security and privacy. Approximately 30% of which were not concerned at all, and only 17% were very concerned. Similarly respondents who have devices in their bathroom or bedroom were also slightly less concerned than all respondents in general, with 29% of each not concerned at all.
User satisfaction is high
Users continue to be quite satisfied with their devices.
We asked respondents how satisfied they are with the device’s ability to understand, the responses, and the overall experience.
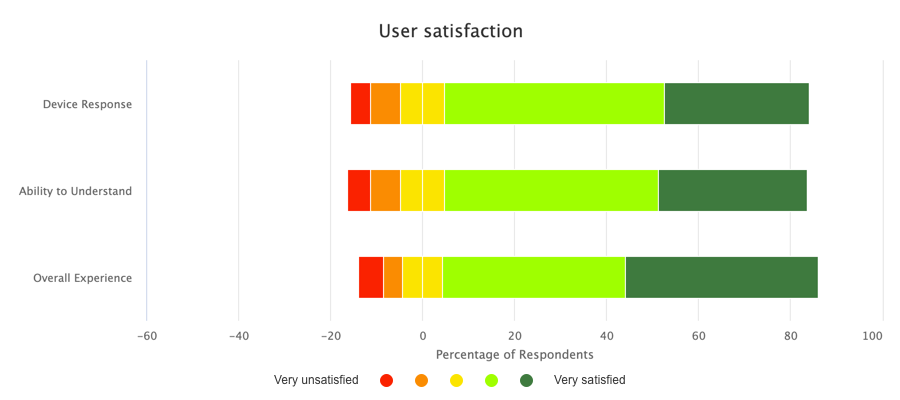 In regards to the device’s ability to understand, 79% of respondents were satisfied to some degree, with 32.5% very satisfied. Only 11.5% were either somewhat or very unsatisfied.
Similarly, in regards the the device’s responses, nearly 80% of respondents were satisfied, with 31.7% very satisfied. Only 11% were either somewhat or very unsatisfied.
Overall, 82% of respondents were satisfied with the device, with 42% very satisfied. Only 9% were either somewhat or very unsatisfied.
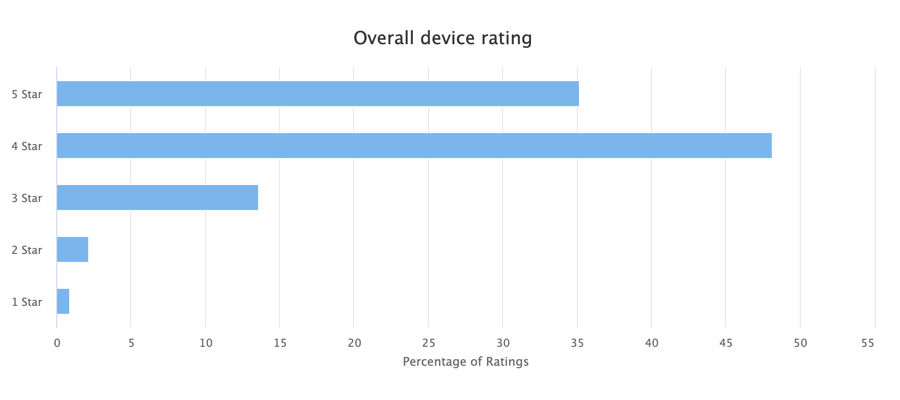
When asked to give the device an overall rating on a one to five star scale, respondents averaged about 4.2 stars. Those respondents who find the devices to be very behavior changing, rate them even higher at 4.7 stars.
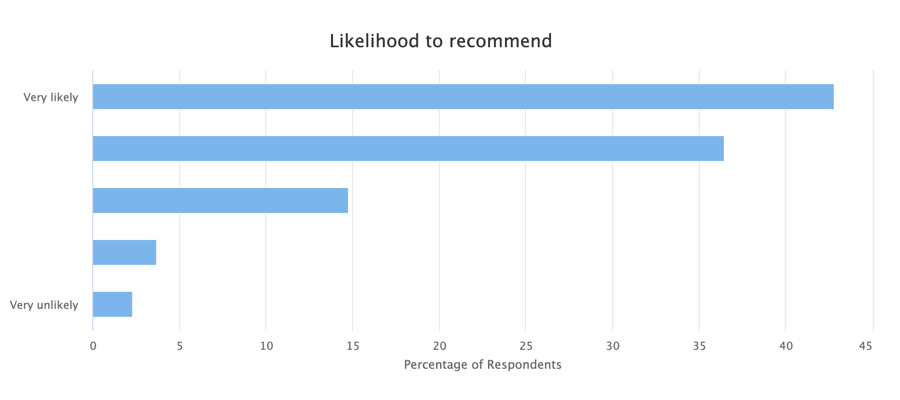
 Respondents are also very likely to recommend a voice assistant device to their friends and family. When asked on a one to five scale to indicate how likely they are to recommend the device, respondents averaged a 4.1 rating. Respondents who found the device to be very behavior changing, are also very likely to recommend the device, with a 4.8 rating on average. Even those respondents who did not find the device to be behavior changing are still likely to recommend one with a 3.6 rating on average.
 We also asked respondents if anything surprised them about the devices. In general, users are quite impressed by how much the devices can do, how “smart” and accurate they are, and how easy they are to use.
Conclusions
Users continue to be happy with their Alexa and Google Home devices. Frequency of use continues to rise. Users tend to have multiple devices in their homes. Users are still quite satisfied with the device’s abilities to understand and respond, and recommend them highly.
While voice assistants are hot, the space is still fairly early. There are opportunities for improving user acquisition and discovery, as well as increasing monetization opportunities for brands and developers.
As the device capabilities continue to get better and adoption grows, we are excited to see what the future holds.
About Dashbot
Dashbot is an analytics platform for conversational interfaces that enables enterprises to increase engagement, satisfaction, and conversion through actionable insights and tools.
In addition to traditional metrics like engagement and retention, we provide chatbot specific analytics including NLP response effectiveness, sentiment analysis, conversation flows, and the full chat session transcripts.
We also have tools to take action on the data, like our Live Person Take Over of chat sessions and push notifications for re-engagement.
We support Alexa, Google Home, Web Chat, SMS, Facebook Messenger, Slack, Twitter, Bixby, and any other conversational interface.
 /blog
/blog